
It is well known that commodity prices are cyclical and that we are currently at a low in the cycle. We know that the global economy is currently struggling and industrial demand has plummeted. Even if we do begin a recovery, it is not going to happen overnight. What will spur commodity prices into the next upswing?
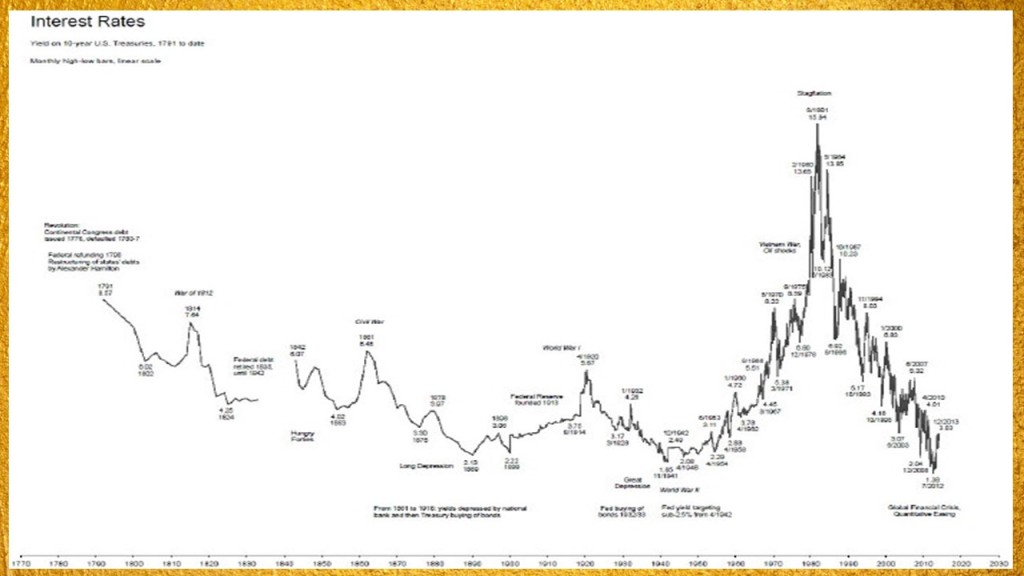
The chart above shows nominal interest rates dating back to 1791. We are currently at a historic lows in terms of the yield on 10-year US Treasuries. However, but this chart does not take inflation into account. Taking inflation into account allows us to determine the real interest rate (i.e. the nominal interest rate minus inflation). The importance of the real interest rate is that represents the purchasing power of investment capital.
If we start by looking at an environment of inflation, and we use the 2% inflation rate that central banks aspire to, when the nominal interest rates are higher, let’s say 6% then the real interest rate is +4% (6%-2%). In this situation the investor would prefer to have these gains rather than buy gold, which provides no yield and also has storage costs. However, as nominal interest rates go lower, real interest rates go into negative territory and that’s even more the case if the nominal rate goes negative. In this case an investor would prefer to buy real assets right now rather than invest their capital over time, in which case they are effectively losing their investing purchasing power. In theory, a negative interest rate is good for gold and commodities.
What if we enter a deflationary environment? We will use an example of -2% rate of inflation (negative means deflation). With a nominal interest rate of +6%, the real interest rate would be +8%. In this example, we can see that the nominal interest rate would need to go deeper into negative territory to make the real rates go low or negative.
Currently the Federal Reserve are working hard to keep nominal interest rates low. Raising rates is likely to trigger defaults since there are many private companies and sovereign countries that can barely make their debt interest payments, even at these low interest rates. We know that the greatest fear of central banks is deflation and they will pull out all the stops to try and avoid deflation. A scenario of low nominal interest rates in combination with inflation is therefore likely, which means persistence of negative real interest rates. If that is the case, then what does it mean for gold?

The chart above shows the real interest rate (blue line) compared to the gold price (red line). There is a strong negative correlation between the two (i.e. as the real interest rate goes down, gold tends to go up). This has certainly been the case for the last 15 years but what about on longer time scales?

The above chart shows that there are some exceptions to the correlation. For example between 2006 and 2009 the real interest rate was positive but despite this, the gold price rose over that period. Currently the real interest rates in the USA are -0.5%. How negative can real interest rates go?

The above chart shows the global real interest rates from 1320. A long-term general decline in the real interest rate is clear to see. There are two huge spikes in the early 1900’s (approximately -10%) which dwarf the small spike that occurred in the 1970s. Another fascinating thing about this chart is that it shows where easing and tightening regimes have occurred. The green areas represent easing and the pink areas represent tightening. We can see that over the last two centuries two things have become apparent. Firstly the easing regimes seem to be getting longer and longer compared to the tightening duration. Secondly the real interest rates get increasingly negative during the periods of easing. When the easing stops and tightening begins, real interest rates go positive again.
Currently, there seems to be no end with regards to easing policies and that suggests that the real interest rates are likely to remain negative. It also suggests that there is potential for real interest rates to go a lot deeper into negative territory.

In 2017, the real interest rate in Venezuela dropped to as low as -80! From this we can deduce that deep negative real rates are certainly within the realms of possibility.

This brings us back to the original question regarding commodities. The chart above shows the commodity index to Dow Jones ratio. Commodities are clearly at historic lows and are undervalued compared to the stock market. The high spikes on the chart correspond with times when real interest rates were negative.
Overall, it seems that there is limited downside as far as commodity prices go. Sideways movement my occur and can last for many years as we saw in the 1960s. In contrast, the upside potential is large, with the potential for a spike upwards.
Conclusion
Negative interest rates is likely to be an important factor in propelling commodities upwards in the coming years. Some may argue that Japan and other countries have had negative nominal interest rates for a few years and it hasn’t had any major effect. However, if you look more closely, in many of those cases the real interest rate has not been particularly negative and in a lot of those countries they’re actually positive. The important factor to consider here is that those countries are not the world’s major reserve currencies and remember that commodities are priced in US dollars. If we do have both negative nominal and real interest rates in the USA, this could well drive investors into the commodities.
